
A histogram is a bar graph that uses the height of the bar to convey the frequency of an event occurring. Each bar in a histogram corresponds to the frequency of occurrence of a specific event.
A Pareto chart displays bars by the height of the bars, signifying the order of impact. It follows the Pareto philosophy (the 80/20 rule) through displaying the events by order of impact.
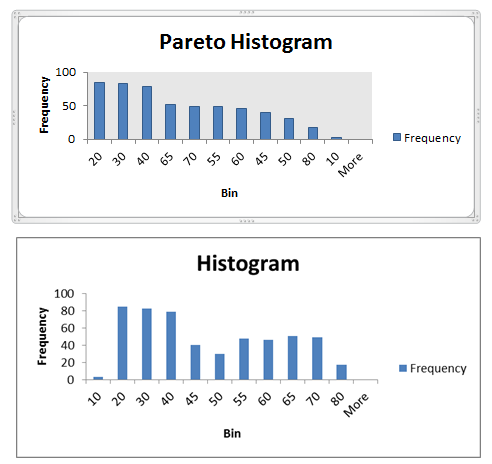
(Image Credit : https://www.thecompanyrocks.com/excels-histogram-tool-8020-rule-analysis/ )